What a Tornado chart shows
Which factor decides repayment capacity — in one figure.
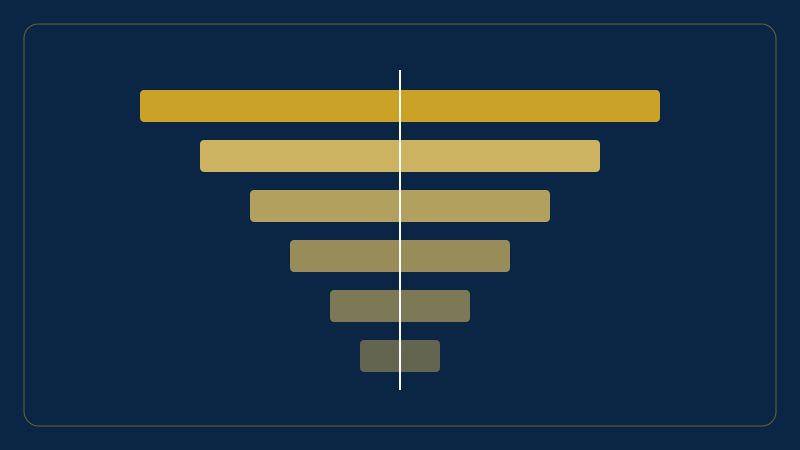
A Tornado chart answers a simple question: if I am wrong about one number, how much does the conclusion change?
Each bar is a factor (income, housing, costs…). We move it up and down — here by ±15% — and record the resulting repayment capacity. The bars are sorted from the longest to the shortest, which is why the figure looks like a tornado.
How to read it
- The vertical line is the base estimate.
- A bar that crosses zero means that the factor on its own can lead to inability.
- Short bars do not need great precision; long bars need the best evidence.
See the worked example on the Financial inability page.