Financial inability towards AADE
From the claim “I cannot pay” to numerical evidence
In procedures for settling or easing debts owed to the Greek tax administration (AADE), the debtor often needs to show their actual financial position. Which documents are required is set each time by the rules in force and by the specific procedure. MLC3 does not replace those rules; it organises the information so that the picture is complete, consistent and verifiable.
Note. This page is illustrative (demo). It is not legal or tax advice; for your own case, consult a lawyer or an accountant.
What usually needs to be shown
Sensitivity analysis (Tornado)
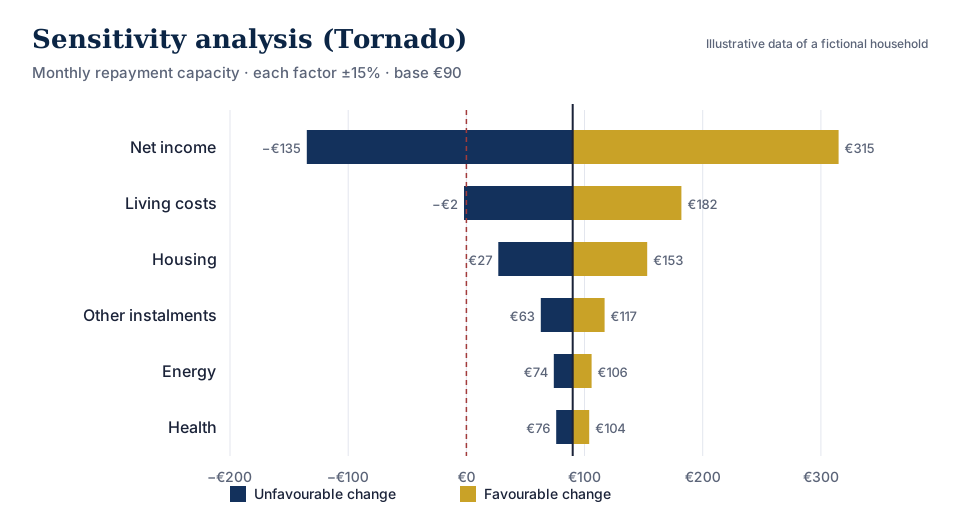
We start from the base estimate (€90 a month) and change one factor at a time by ±15%. The longer the bar, the more the conclusion depends on that factor. Here net income dominates: a 15% fall is enough to make the capacity negative.
Data table of Figure 1
| Factor | Unfavourable −15% | Favourable +15% | Range |
|---|---|---|---|
| Net income | −135 | 315 | 450 |
| Living costs | −2 | 182 | 184 |
| Housing | 27 | 153 | 126 |
| Other instalments | 63 | 117 | 54 |
| Energy | 74 | 106 | 32 |
| Health | 76 | 104 | 28 |
Monte Carlo simulation
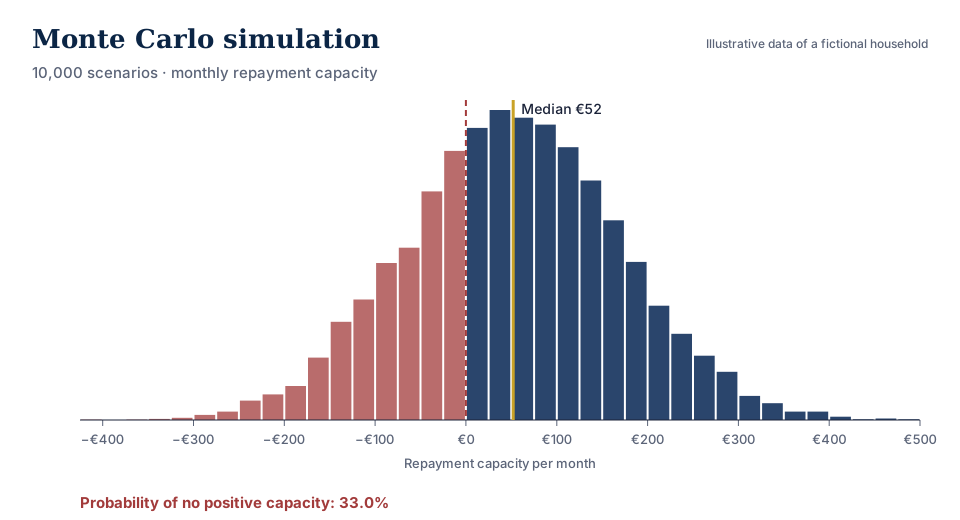
Sensitivity changes one factor at a time; in reality they all change together. The Monte Carlo simulation draws values from distributions (income: normal; costs: triangular) and computes the capacity in 10,000 scenarios. The result is not one number but a probability of inability.
Data table of Figure 2
| Measure | Value |
|---|---|
| 5th percentile | −144 |
| Median | 52 |
| Mean | 52 |
| 95th percentile | 248 |
| Probability of no positive capacity | 33.0% |
What it means for the file
With a base estimate of €90, the file would show a “small but positive” capacity. The analysis shows something more precise: in about one scenario in three the household cannot pay anything, and the risk comes mainly from income. That is an argument based on data — and it can be checked.
Both sample reports are available as PDFs among the scientific reports.