Monte Carlo: from one number to a distribution
Why a “probability of inability” says more than a point estimate.
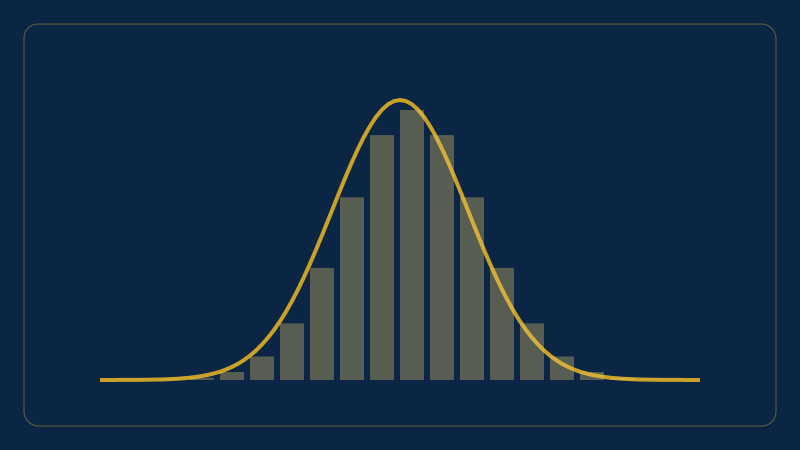
An estimate of “€90 a month” hides the uncertainty. Income may fall, health costs may rise — and usually everything changes at the same time.
A Monte Carlo simulation describes each uncertain quantity with a distribution and computes the result in thousands of scenarios. The resulting histogram shows how often the repayment capacity is negative.
Three rules
- Distributions are based on data, not on intuition.
- There are enough scenarios for the result to stay stable (here 10,000).
- The simulation is reproducible: same seed, same result.
In our example the probability of no positive capacity is 33%. See Figure 2.